Should you buy or rent a house? Buying your own home can be expensive but could save you money over the years. Renting a property through a letting agent or private landlord offers less autonomy to live by your own rules, with more flexibility if you need to move.
Yet, there is third way that many people seem to forget, yet it plays an important role in the housing of Chelmsford people. Collectively known as social housing, it is affordable housing, which is let by either Chelmsford City Council or a housing association to those considered to be in specific need, at rents below those characteristic in the private rental market.
In Chelmsford, there are 6,946 social housing households, which represent 15.02% of all the households in Chelmsford. There are a further 5,439 families in the Chelmsford City Council area on their waiting list, which is similar to the figures in the late 1990’s. The numbers peaked in 2005, when it stood at 5,752 families, so today’s numbers represent a drop of 5.44%.
Nevertheless, this doesn’t necessarily mean that more families are being supplied with their own council house or housing association property. Six years ago, Westminster gave local authorities the authority to limit entitlement for social housing, quite conspicuously dismissing those that did not have an association or link to the locality.
Interestingly, the rents in the social rented segment have also been growing at a faster rate than they have for private tenants. In the Chelmsford City Council area, the average rent in 1998 for a council house/housing association property was £209.56 a month. Whilst we have no up to date figures, because of the ‘Large Scale Voluntary Transfer’ of all or most of the local authority’s stock was transferred to a Private Registered Provider sector, so the average rent is no longer applicable. Therefore, using the average rent increase for England of 108% (England’s average rent being £183.08 a month in 1998 and £381.03 a month today) we can guesstimate an average of approximately £435.
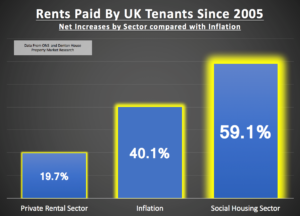
When comparing social housing rents against private rents, the stats don’t go back to the late 1990’s for private renting, so to ensure we compare like for like, we can only go back to 2005. Over the last 12 years, private rents have increased nationally by a net figure of 19.7%, whilst rents for social housing have increased by 59.1%.

So, what does this all mean for the homeowners, landlords and tenants of Chelmsford?
Rents in the private rental sector in Chelmsford will increase sharply during the next five years. Even though the council house waiting list has decreased, the number of new council and housing association properties being built is at a 70 year low. The government crusade against buy-to-let landlords together with the increased taxation and the banning of tenant fees to agents will restrict the supply of private rental property, which in turn using simple supply and demand economics, will mean private rents will rise – making buy to let investment a good choice of investment again (irrespective of the increased fees and taxation laid at the door of landlords). It will also mean property values will remain strong and stable as the number of people moving to a new house (and selling their old property) will continue to remain restricted and hence, due to lack of choice and supply, buyers will have to pay decent money for any property they wish to buy.
Interesting times ahead for the Chelmsford Property Market!


